

Lead Provider of Environmental Test Chamber


 Posted on
22 10 2026


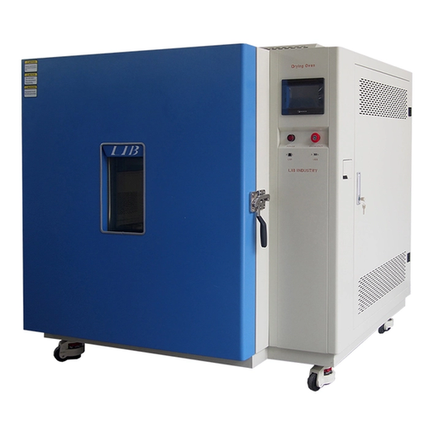
Alt:Drying Oven Temperature Uniformity Verification Guide
Drying oven temperature uniformity verification checks whether every usable shelf position stays within the approved temperature band after the oven has stabilized. A controller reading alone cannot answer that question. A practical verification uses calibrated sensors at mapped locations, tests both empty and representative loads, records recovery after door opening, and defines pass criteria before data collection starts.
A batch can look consistent at loading and still leave the oven with different moisture levels. The tray nearest the supply duct may heat first. A dense rack near the door may lag. If the process is adhesive curing, powder drying, glassware preparation, polymer conditioning or component aging, those differences can alter mass loss, hardness, colour or electrical behaviour.
Uniformity is a spatial measurement. Stability describes movement at one point over time, while controller accuracy compares the displayed value with a reference. These terms are related but not interchangeable. An oven can hold its control probe at 120°C with very little fluctuation and still have a rear corner at 126°C and a loaded centre tray at 113°C.
LIB publishes temperature range and control information for its industrial drying ovens. Those figures are a starting point. The acceptance method must also state the load, shelf arrangement, sensor positions and stabilization rule used during verification.
Begin with the process requirement, not a default nine-point diagram. Identify the setpoints used in production, the largest routine load, the allowed temperature band and the longest door-open event. Decide whether the survey supports equipment acceptance, periodic calibration, troubleshooting or process validation. Each purpose calls for different evidence.
Write the limit as a number and a condition. For example: every air sensor remains between 118°C and 122°C for 30 minutes after all points meet the stabilization rule. If product temperature matters, add separate limits for probes placed inside representative items. Do not replace these limits with phrases such as “stable” or “even.” They are impossible to sign off consistently.
Reference sensors should cover the working range and have calibration records traceable to the laboratory quality system. Place the logger outside the hot zone unless it is rated for the exposure. A one-minute interval is common for slow drying work, while fast recovery checks may need shorter intervals. The interval should capture the behaviour that matters without creating a file too large to review.
An empty survey establishes the oven’s basic airflow pattern. For a rectangular workspace, a nine-point layout usually includes eight positions near the usable corners and one at the centre. Keep probes away from walls, heaters and metal shelves unless those surfaces are part of the defined usable zone. Record the distance from each probe to the nearest wall so the layout can be repeated.
Start recording before heating begins. This shows the warm-up curve and makes overshoot visible. The controller reaching setpoint is not the start of the uniformity period. Wait until all mapped sensors enter a predefined band and remain there for the stated time. A large oven can show a steady display while the corner probes continue to climb.
At each recorded time, subtract the lowest sensor value from the highest. Review the maximum spread as well as the average. An average can hide a short cold spot after a door opening or a hot corner during heater cycling. The report should show each channel, the calculated spread and the time window used for the final result.
|
Check |
What to record |
Common mistake |
|---|---|---|
|
Sensor layout |
Numbered map and distance from walls |
Moving probes between setpoints |
|
Stabilization |
Rule based on all channels |
Starting when display reaches setpoint |
|
Uniformity |
Highest minus lowest location |
Reporting controller accuracy instead |
|
Stability |
Change at each point over time |
Averaging away short excursions |
|
Recovery |
Time after a defined door opening |
Using an unrecorded manual observation |
Control and monitoring
The loaded survey is usually more valuable than the empty result. Trays, racks and wet material redirect airflow and absorb heat. Moisture evaporation also changes the heat balance. Use a load that represents the heaviest routine batch, including packaging, containers and shelf spacing. If production loads vary widely, test the two arrangements most likely to create blocked airflow or high thermal mass.
Place some sensors in the air and others on or inside the product surrogate. Air temperature tells whether the oven controls the workspace. Product probes show when the process actually begins. A metal part may reach the air setpoint quickly, while a sealed container filled with powder can lag for much longer. That lag should influence the drying timer.
For smaller samples and lower-temperature development work, a benchtop temperature humidity chamber may support controlled thermal studies, but an oven uniformity survey still has to represent the final production setup.
Production staff open doors. A verification that ignores this event describes an ideal condition rather than the process. Define the opening duration, how far the door is opened and whether a rack is moved. Record the lowest temperature at each position and the time required for every point to return to the acceptance band.
Use the result to write an operating rule. If the rear sensor recovers in four minutes but the centre of a dense tray needs eighteen, a five-minute display recovery is misleading. The timer should restart only when the process-critical location has recovered, or the door-open allowance should be built into the approved cycle.
Do not adjust the controller immediately. First confirm probe identity, calibration status and placement. Then inspect airflow paths, shelf loading, fan direction, door gaskets and exhaust position. A tray pushed against the return grille can create a cold centre without any controller fault. A worn gasket often shows up as a cool front corner and longer recovery.
• Repeat the failed condition with the same load before changing the setup.
• Run an empty check to separate oven performance from load effects.
• Document fan speed, exhaust position and ambient room conditions.
• After an adjustment, repeat every affected setpoint rather than one convenient temperature.
Control and monitoring
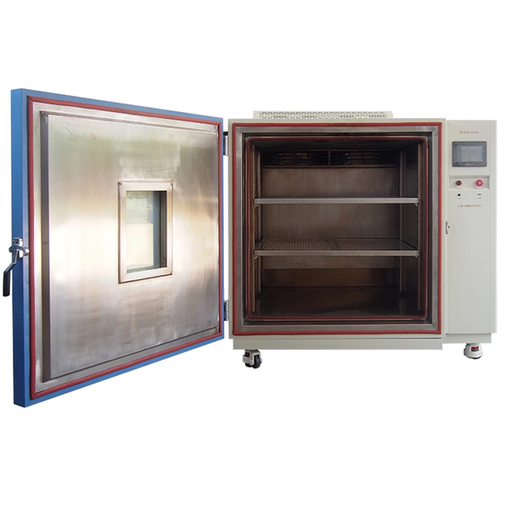
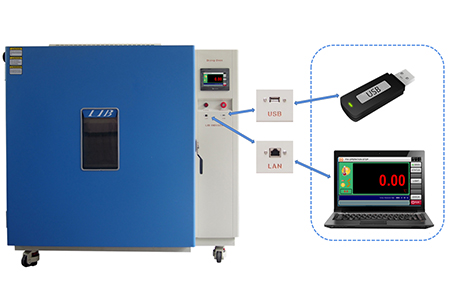
LIB drying ovens are available in several temperature and capacity configurations for drying, heat exposure and material processing. The published product information includes programmable control, data export, stainless-steel interiors, adjustable shelves and safety protection. For a uniformity-sensitive purchase, buyers should also provide the usable load dimensions, shelf count, target setpoints and permitted deviation.
A useful quotation should state how the published temperature deviation was measured and what loading condition applies. Ask whether the factory can demonstrate the agreed sensor layout before shipment. If the process releases moisture, solvent or corrosive vapour, disclose that before configuration; exhaust, sealing and safety requirements may change.
LIB’s broader test chamber product range can help laboratories compare oven work with climatic cycling, corrosion and ingress testing when one product needs several environmental checks.
For repeat purchases, keep the first approved mapping file as a benchmark. Compare later ovens at the same setpoints, sensor locations and representative load. This does not require every unit to produce identical traces; it gives the quality team a consistent way to identify unusual recovery, overshoot or shelf gradients before the oven enters routine use. If a process is transferred to a larger oven, repeat the mapping rather than scaling the old drying time by volume. Air path, heater cycling and load density change with chamber geometry.
Xi’an LIB Environmental Simulation Industry is an environmental test chamber supplier that manufactures standard and custom systems for climatic, corrosion, weathering, ingress and high-temperature testing. The company states that it began exporting test chambers in 2009 and supports equipment selection, transport, installation, calibration, training and spare parts.
Labs planning an oven purchase can review LIB’s service and training support before defining factory acceptance, installation and operator handover requirements.
Drying oven temperature uniformity verification should reproduce the way the oven is actually used. Map the empty workspace, repeat the survey with a representative load, measure recovery after door opening and keep the acceptance band tied to product quality. A clear sensor map and raw channel data make the result repeatable. They also turn oven selection from a catalogue comparison into a process decision.
The questions below address the points that most often affect a drying oven temperature mapping plan.
Nine sensors are a common starting layout for a rectangular workspace, but large, critical or densely loaded ovens may need more. Sensor count should reflect the usable volume and suspected hot or cold zones.
Both conditions are useful. The empty test checks basic oven performance, while the loaded test shows how racks, trays and product mass change airflow, heat-up time and uniformity.
Stability is temperature change at one location over time. Uniformity is the difference between locations at the same time.
Repeat it after installation, major repair, sensor or fan changes, relocation, a significant load change, or at the interval required by the laboratory quality system.




 EN


